Iran Normalized Citation Impact (NCI) in the World
Normalized Citation Impact
The Normalized Citation Impact (NCI) of a document is calculated by dividing the actual count of citing items by the expected citation rate for documents with the same document type, year of publication and subject area. When a document is assigned to more than one subject area an average of the ratios of the actual to expected citations is used. The NCI of a set of documents, for example the collected works of an individual, institution or country, is the average of the NCI values for all the documents in the set.
For a single paper that is only assigned to one subject area, this can be represented as:

For a single paper that is assigned to multiple subjects, the NCI can be represented as the average of the
ratios for of actual to expected citations for each subject area:

For a group of papers, the NCI value is the average of the values for each of the papers, represented as:

Where: e = the expected citation rate or baseline, c = Times Cited, p = the number of papers, f = the field or subject area, t = year, d = document type, n = the number of subjects a paper is assigned to and i = the entity being evaluated (institution, country, person, etc).
NCI is a valuable and unbiased indicator of impact irrespective of age, subject focus of document type. An NCI value of 1 represents performance at par with world average, values above 1 are considered above average and values below 1 are considered below average.
NCI is a valuable and unbiased indicator of impact irrespective of age, subject focus or document type. Therefore, it allows comparisons between entities of different sizes and different subject mixes. An NCI value of one represents performance at par with world average, values above one are considered above average and values below one are considered below average. An NCI value of two is considered twice world average.
Note: A quirk of the way baselines are calculated (whole counting of subjects for papers in more than one subject category) and the way NCI is calculated (fractional counting of subjects for papers in more than one subject category) results in the NCI of the world not being equal to one exactly.
NCI is an ideal indicator for benchmarking at all organizational levels (author, institution, region etc). One can also use NCI to identify impactful sub-sets of documents and assess any research activity. For example, an institution may use the NCI to assess which collaborations are the most impactful or identify new potential collaboration opportunities. Or to identify the performance of up-and-coming researchers compared to established ones and to aid with faculty recruitment by assessing candidates. As a funding organization, one may use the NCI as a quantitative performance indicator to monitor the performance of funded projects, or assess the track record of a research teams applying for a new funding.
There are known issues with using NCI:
- When dealing with small sets of publications, for example, the publications of one individual, the NCI values may be inflated by a single highly cited paper.
- Because it is an average, even when looking at larger sets of publications, such as the collected works of an institution, very highly cited papers can have an unduly large influence on the NCI value.
- As discussed elsewhere, the baseline values for current year can be very low and therefore the NCI values for current year can fluctuate more than expected.
To overcome these issues there are some steps that can be taken:
- Use the NCI value alongside other indicators to have a picture of performance as a whole and to identify anomalies and data artefacts.
- Use larger sets of publications when possible, for example, by extending the time period or expanding the number of subjects to be covered.
- Show care when analyzing documents from most recent publication years. Include document from a range of years for a more meaningful analysis.
- Limit your analysis to significant research publications by limiting to those papers that have the document type of Article or Review. If appropriate, to aid increased coverage of some fields, the document types of Book Chapters and Conference Proceedings may also be considered.
- Always use citation indicators to aid human judgment rather than to replace it.
Complementary indicators that can be used alongside the NCI include:
- Journal Normalized Citation Impact
- % Documents in Top 1% and % Documents in Top 10%
- Average Percentile
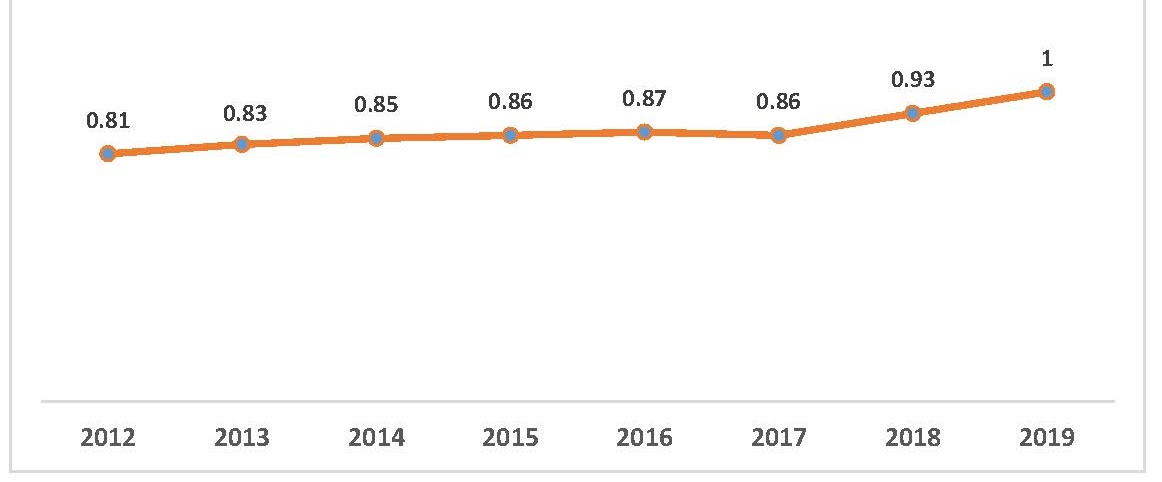
An examination of Iran NCI in WoS database shows that in recent years this index has been increasing and improving. Specifically, in 2012, the normalized citation was 0.81, which increased to 0.86 in 2017, to 0.93 in 2018, and finally to one in 2019.
Your Comment :