ISC published
THE World University Rankings 2022: results announced
With the presence of 12 new Iranian universities, the number of universities in this ranking system increased to 58
Office of International and Scientific Cooperation, Sep 2nd, 2021, Shiraz
The Times Higher Education World University Rankings 2022 include more than 1,600 universities across 99 countries and territories, making them the largest and most diverse university rankings to date.
The table is based on 13 carefully calibrated performance indicators that measure an institution’s performance across four areas: teaching, research, knowledge transfer and international outlook.
This year’s ranking analyzed more than 108 million citations across over 14.4 million research publications and included survey responses from almost 22,000 scholars globally. Overall, we collected over 430,000 data points from more than 2,100 institutions that submitted data.
Trusted worldwide by students, teachers, governments and industry experts, this year’s league table reveals how the Covid-19 pandemic has started to shift global higher education performance.
The University of Oxford tops the ranking for the sixth consecutive year, while mainland China has two institutions in the top 20 for the first time: Peking University and Tsinghua University share 16th place.
Institut Polytechnique de Paris is the highest new entry at 95th place, following a merger of five institutions.
The US is the most-represented country overall with 183 institutions, and also the most represented in the top 200 (57), although its share of universities in this elite group is falling.
Mainland China now has the joint fifth highest number of institutions in the top 200 (up from joint seventh last year), overtaking Canada and on a par with the Netherlands.
View the World University Rankings 2022 methodology
The Times Higher Education World University Rankings are the only global performance tables that judge research-intensive universities across all their core missions: teaching, research, knowledge transfer and international outlook. THE uses 13 carefully calibrated performance indicators to provide the most comprehensive and balanced comparisons, trusted by students, academics, university leaders, industry and governments.
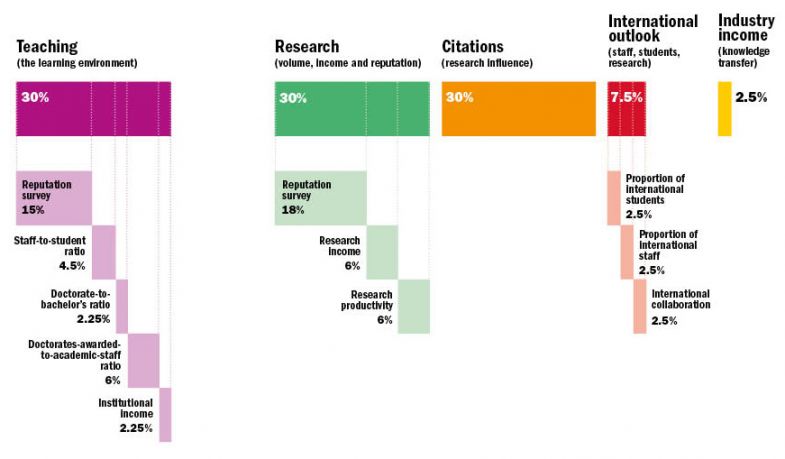
The performance indicators are grouped into five areas: Teaching (the learning environment); Research (volume, income and reputation); Citations (research influence); International outlook (staff, students and research); and Industry income (knowledge transfer).
Teaching (the learning environment): 30%
Reputation survey: 15%
Staff-to-student ratio: 4.5%
Doctorate-to-bachelor’s ratio: 2.25%
Doctorates-awarded-to-academic-staff ratio: 6%
Institutional income: 2.25%
The most recent Academic Reputation Survey (run annually) that underpins this category was carried out between November 2020 and February 2021. It examined the perceived prestige of institutions in teaching and research. The responses were statistically representative of the geographical and subject mix of academics globally. The 2021 data are combined with the results of the 2020 survey, giving almost 22,000 responses.
As well as giving a sense of how committed an institution is to nurturing the next generation of academics, a high proportion of postgraduate research students also suggests the provision of teaching at the highest level that is thus attractive to graduates and effective at developing them. This indicator is normalised to take account of a university’s unique subject mix, reflecting that the volume of doctoral awards varies by discipline.
Institutional income is scaled against academic staff numbers and normalised for purchasing-power parity (PPP). It indicates an institution’s general status and gives a broad sense of the infrastructure and facilities available to students and staff.
Research (volume, income and reputation): 30%
Reputation survey: 18%
Research income: 6%
Research productivity: 6%
The most prominent indicator in this category looks at a university’s reputation for research excellence among its peers, based on the responses to our annual Academic Reputation Survey (see above).
Research income is scaled against academic staff numbers and adjusted for purchasing-power parity (PPP). This is a controversial indicator because it can be influenced by national policy and economic circumstances. But income is crucial to the development of world-class research, and because much of it is subject to competition and judged by peer review, our experts suggested that it was a valid measure. This indicator is fully normalised to take account of each university’s distinct subject profile, reflecting the fact that research grants in science subjects are often bigger than those awarded for the highest-quality social science, arts and humanities research.
To measure productivity we count the number of publications published in the academic journals indexed by Elsevier’s Scopus database per scholar, scaled for institutional size and normalised for subject. This gives a sense of the university’s ability to get papers published in quality peer-reviewed journals. Last year, we devised a method to give credit for papers that are published in subjects where a university declares no staff.
Citations (research influence): 30%
Our research influence indicator looks at universities’ role in spreading new knowledge and ideas.
We examine research influence by capturing the average number of times a university’s published work is cited by scholars globally. This year, our bibliometric data supplier Elsevier examined more than 108 million citations to 14.4 million journal articles, article reviews, conference proceedings, books and book chapters published over five years. The data include more than 24,600 academic journals indexed by Elsevier’s Scopus database and all indexed publications between 2016 and 2020. Citations to these publications made in the six years from 2016 to 2021 are also collected.
The citations help to show us how much each university is contributing to the sum of human knowledge: they tell us whose research has stood out, has been picked up and built on by other scholars and, most importantly, has been shared around the global scholarly community to expand the boundaries of our understanding, irrespective of discipline.
The data are normalised to reflect variations in citation volume between different subject areas. This means that institutions with high levels of research activity in subjects with traditionally high citation counts do not gain an unfair advantage.
We have blended equal measures of a country-adjusted and non-country-adjusted raw measure of citations scores.
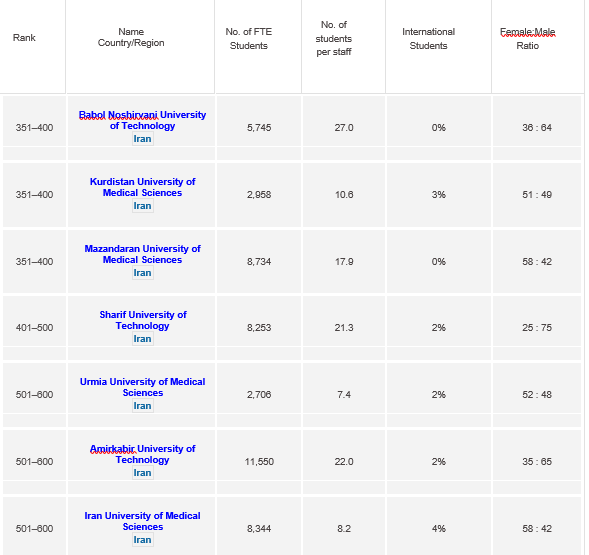
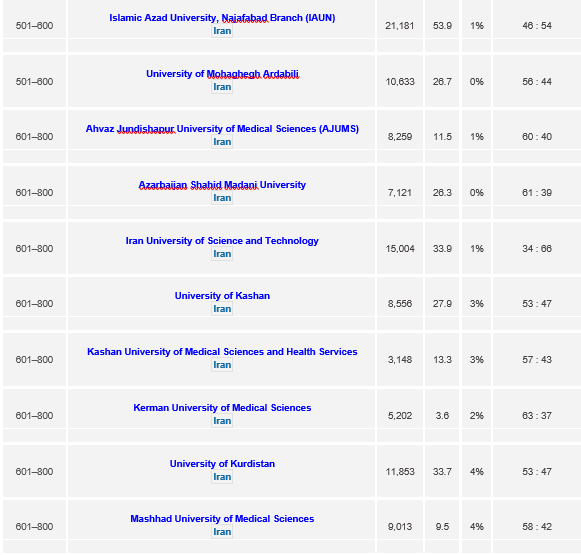
Iranian universities in the Times 2022 ranking
There was only one university in Iran in the Times rankings from 2012 to 2014. In 2015, Sharif University of Technology and Isfahan University of Technology were in this ranking and in 2016, the number of universities reached 8.
In 2017, the number of Iranian universities has increased to 13 universities. In 2018, increased to 18 universities, and in 2019, 2020 and 2021 to 29, 40 and 47 universities.
In 2022, with 12 newcomer universities, we could see the presence of 58 ranked universities from the Islamic Republic of Iran in a total of 1600 world top universities from 99 countries, where the names of 4 universities are mentioned in this ranking as reporters. (This shows Iranian universities’ prestigious international presence in rankings.)
Your Comment :